R Bootcamp (in-class tutorial)
Hannes Datta
Structure of this tutorial
Based on https://datacarpentry.org/r-socialsci/ (chapters 1-4)
- In-class part: Introduction to R and starting with data and data wrangling
This part features selected issues.
- After class: please complete chapters 1-4 at your own pace.
Introduction to R
- What is R? What is RStudio?
- Why learn R?
- no point and clicking (good!)
- great for reproducibility
- interdisciplinary & extensible
- supports all data formats
- can produce high-quality graphics
- has a large community
- it's free, open-source and cross-platform!
- works even in the cloud!
- But… can be geeky + many ways to do the “same thing” (-> confusing!), e.g.,
data.tablevs.dplyr
DO: Creating a new project
- Under the File menu, click on New project, choose New directory, then New project
- Enter a name for this new folder (or “directory”) and choose a convenient location for it. This will be your working directory for the rest of the day (e.g., ~/data-carpentry)
- Click on Create project
- Create a new file where we will type our scripts. Go to File > New File > R script. Click the save icon on your toolbar and save your script as “script.R”.
The RStudio Interface
- four panes: source code, console, environment/history, files
- setting and checking working directories (
setwd()andgetwd()) - relative directories vs. absolute directories, use of
here()
DO: Organize working directory
- Directory structure (for tutorial; different structures used later)
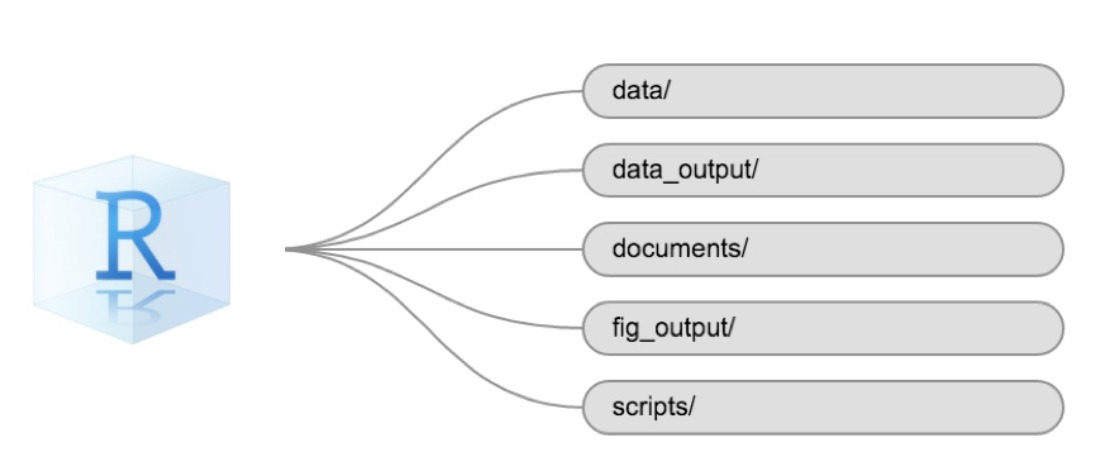
dir.create("data") # continue w/ other directories
- Can you come up with other ways to create a folder/directory structure?
Interacting with R
- Running code (ctrl + R, buttons, running code top-down)
- Installing additional packages (package tab or
install.packages()) - DO: Let's all verify package
tidyverseis installed!
Using R
- as a calculator
- variable assignment
- calculating with variables
- = vs. ==
- functions
- using functions (e.g.,
round()) - getting help on functions
- what functions exist? –> cheat sheet for base R
- using functions (e.g.,
- vectors and data types (
c(1,2,3),c("Berlin", "Barcelona"),NA) - subsetting vectors (explicitly, conditionally with logical operators)
DO: A bit of practice
- Assign the following values to the variable
rooms: 1, 2, 1, 8 - Use the function
max()to calculate the maximum number of rooms - Modify rooms by adding
NAto it: 1, 2, 1, 8, NA (why do we needNAs?) - Recalculate the maximum & check the help (
?max, followed by enter) to see how to tackle the problem! - Write a bit of code to return the third value of
rooms - Write a bit of code to return the number of rooms larger or equal to 2. Tip:
length()& conditional subsetting required!
Starting with data
- individual values vs. “holding data” (rows, colums)
- difference between Excel & R? Each column holds the same data type!
- R tutorial proceeds w/ non-marketing data; here, we use some music streaming data instead
DO: Download and open the dataset!
- Download the data to your computer
download.file("https://raw.githubusercontent.com/hannesdatta/course-dprep/master/content/docs/modules/week4/regional-global-daily-latest.csv", "streams.csv")
- Load the data into R using the tidyverse
read_csv()function
library(tidyverse)
streams <- read_csv('streams.csv', skip=1)
- Then, take a look at the data by typing in the console…
streams # full preview
head(streams) # limited preview
view(streams) # point-and click view
nrow(streams) # number of rows ("size")
summary(streams) # show basic summary statistics
Tips:
- Beware of “looking” at large datasets!
nrow(streams)is your friend! - You may have to experiment with options in
read_csv, e.g., separation characters.
Working with data from a table
$column_nameshows data, e.g.,streams$Artist- make use of tabs for auto-completion!
- converting character variables to factor variables (and back);
as.factor() - self-study preview: using dates!
`dplyr` 101: basic commands and pipes
select(): subsetting/selecting columns
streams %>% select(`Track Name`)
# A tibble: 200 × 1
   `Track Name`
   <chr>
 1 STAY (with Justin Bieber)
 2 INDUSTRY BABY (feat. Jack Harlow)
 3 THATS WHAT I WANT
 4 Heat Waves
 5 Woman
 6 Bad Habits
 7 Pepas
 8 MONTERO (Call Me By Your Name)
 9 Shivers
10 Beggin'
# ℹ 190 more rows
`dplyr` 101: basic commands and pipes
filter(): subset rows on conditions
streams %>% filter(`Track Name` == "Pepas")
# A tibble: 1 × 5
  Position `Track Name` Artist  Streams URL
     <dbl> <chr>        <chr>     <dbl> <chr>
1        7 Pepas        Farruko 4048596 https://open.spotify.com/track/5fwSHlTE…
`dplyr` 101: basic commands and pipes
mutate(): create new columns by using information from other columns
streams <- streams %>% mutate(weekly_streams = `Streams` * 7)
streams %>% select(`Track Name`, `Streams`, weekly_streams)
# A tibble: 200 × 3
   `Track Name`                      Streams weekly_streams
   <chr>                               <dbl>          <dbl>
 1 STAY (with Justin Bieber)         8469665       59287655
 2 INDUSTRY BABY (feat. Jack Harlow) 7189005       50323035
 3 THATS WHAT I WANT                 4554200       31879400
 4 Heat Waves                        4476838       31337866
 5 Woman                             4201276       29408932
 6 Bad Habits                        4158040       29106280
 7 Pepas                             4048596       28340172
 8 MONTERO (Call Me By Your Name)    3762718       26339026
 9 Shivers                           3742188       26195316
10 Beggin'                           3646313       25524191
# ℹ 190 more rows
`dplyr` 101: basic commands and pipes
group_by() and summarize(): create summary statistics on grouped data
streams %>% group_by(Artist) %>% summarize(total_streams = sum(Streams))
# A tibble: 121 × 2
   Artist        total_streams
   <chr>                 <dbl>
 1 $uicideboy$          862781
 2 24kGoldn            1293398
 3 A-Wall               817164
 4 ATB                  757095
 5 Ariana Grande       2539856
 6 Aventura            2149469
 7 Avicii              1610117
 8 BTS                 4739470
 9 Baby Keem           1558924
10 Bad Bunny           3567213
# ℹ 111 more rows
`dplyr` 101: basic commands and pipes
arrange(): sort results; use desc() to show in descending order
streams %>% group_by(Artist) %>% summarize(total_streams = sum(Streams)) %>% arrange(desc(total_streams))
# A tibble: 121 × 2
   Artist         total_streams
   <chr>                  <dbl>
 1 Lil Nas X           24334525
 2 Doja Cat            14534676
 3 Drake               13979533
 4 Olivia Rodrigo      13589501
 5 Ed Sheeran           9810986
 6 The Kid LAROI        9353107
 7 The Weeknd           6671164
 8 Billie Eilish        6634519
 9 J Balvin             5970510
10 Måneskin             5484032
# ℹ 111 more rows
`dplyr` 101: basic commands and pipes
count(): count discrete values
streams %>% count(Streams>1E6)
# A tibble: 2 × 2
  `Streams > 1e+06`     n
  <lgl>             <int>
1 FALSE                98
2 TRUE                102
DO: Let's practice!
select(): subset columnsfilter(): subset rows on conditionsmutate(): create new columns by using information from other columnsgroup_by()andsummarize(): create summary statistics on grouped dataarrange(): sort resultscount(): count discrete values
- Show only the columns Artist and Track Name from streams. Tip:
select() - Show all observations by Lil Nas X. Tip:
filter() - Sum up all streams by artist: Tip:
group_by()andsummarize() - Sort the results from (3) in descending order
Tip: also check out the dplyr cheatsheet
Writing a code file (and running it in your terminal)
- We use RStudio for prototyping code
- For “production”, we usually run our code via the terminal/command line
- First, we have to store our code as a
.Rfile - Then, we can call it via the terminal
R --vanilla < filename.R(gives output)Rscript filename.R(gives only output if made explicit)
Let's try it out!
Next steps
- Complete this tutorial at Data Carpenetry's R for Social Scientists (link see course website, chapters 1-4)
- Form and register teams! (remember: mix skills!)
- Review course material/course website